or
Log in
Find what you need to study
2.8 The Effects of Government Intervention in Markets
5 min read•june 18, 2024
Jeanne Stansak
dylan_black_2025
Jeanne Stansak
dylan_black_2025
Markets and the Government
In this unit, we define a as a structure that brings together sellers and buyers. However, there is a larger entity that we have yet to consider: the government. In microeconomics, the government has power over markets, and is able to do two main things: controlling prices with ceilings and floors and impacting the price of goods via excise, or per-unit taxes.
This guide will dive into the inner workings of the relationship between the government and markets and visualize how the is impacted by .
Price Controls: Ceilings and Floors
Price Ceilings
As the name implies, a price ceiling is a price maximum. When the government sets a price ceiling, firms are able to sell at any price up to and including the ceiling, but not above it. An example of a price ceiling is rent control, in which the government sets a maximum rent that landlords must abide by. A price ceiling is only effective when the ceiling is below the equilibrium price for the , since otherwise all firms would just sell at the equilibrium price meaning the ceiling has no point.
A ceiling can be seen almost exactly like a like we looked at when discussing disequilibrium. Like before, we have lower quantity supplied from the low price and higher quantity demanded, leading to the following graph:
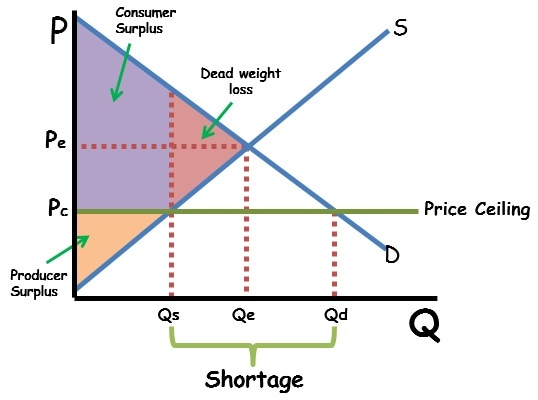
In this graph, we have a maximum price of Pc. Like before, we have a of all consumers who are willing to pay up to Qs, and a normal . The lost CS and PS is .
Price Floors
A price floor is a price minimum that is set by the government. When a price floor is in place, firms are not allowed to sell their goods or services for a price lower than the floor. An example of a price floor is the , which is the lowest amount that an employer can pay their employees. A price floor is only effective if it is above the equilibrium price for the , as firms will sell their goods or services at the equilibrium price if it is higher than the floor. If the price floor is below the equilibrium price, it will not have any effect on the .
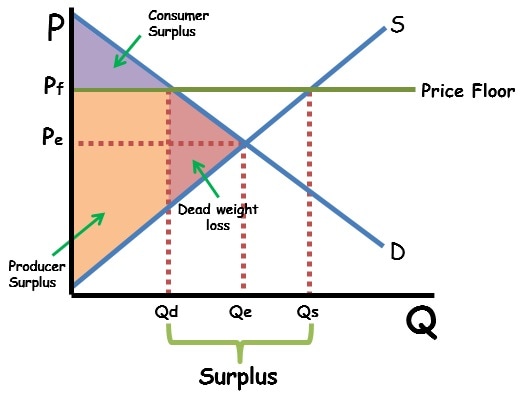
A price floor can lead to a in the , as the quantity of goods or services supplied will be higher than the quantity demanded at the floor price. This can result in a of goods or services, which can lead to lower prices and increased competition among firms. The can also lead to a reduction in the quantity of goods or services produced, as firms may not be able to sell their products at a high enough price to cover their costs. This can lead to a reduction in the overall efficiency of the .
This can be seen in the following graph, with the same logic applied as from a price ceiling:
Non-Effective Price Controls
As we noted before, a price control will only be effective if it excludes the equilibrium price. This is because if it doesn't, firms will just do the same thing they would without the floor: sell at the equilibrium price and quantity. This is an important fact to remember, as sometimes the AP exam will deliberately test your understanding of by giving you a non-effective price control.
Excise Taxes and Tax Incidence
Excise vs. Lump-Sum Taxes
The second action taken by the government is taxation. Taxation is the process by which the government charges a firm a certain amount of money. This can be via. an excise tax or a . An excise tax is also known as a per-unit tax since it is a tax on every single unit produced. By comparison, a is independent of quantity. This section will focus on how impact the supply curve.
Graphing Excise Taxes
An excise tax can be understood as an increase in the costs of production, so an increase in shifts supply to the left:
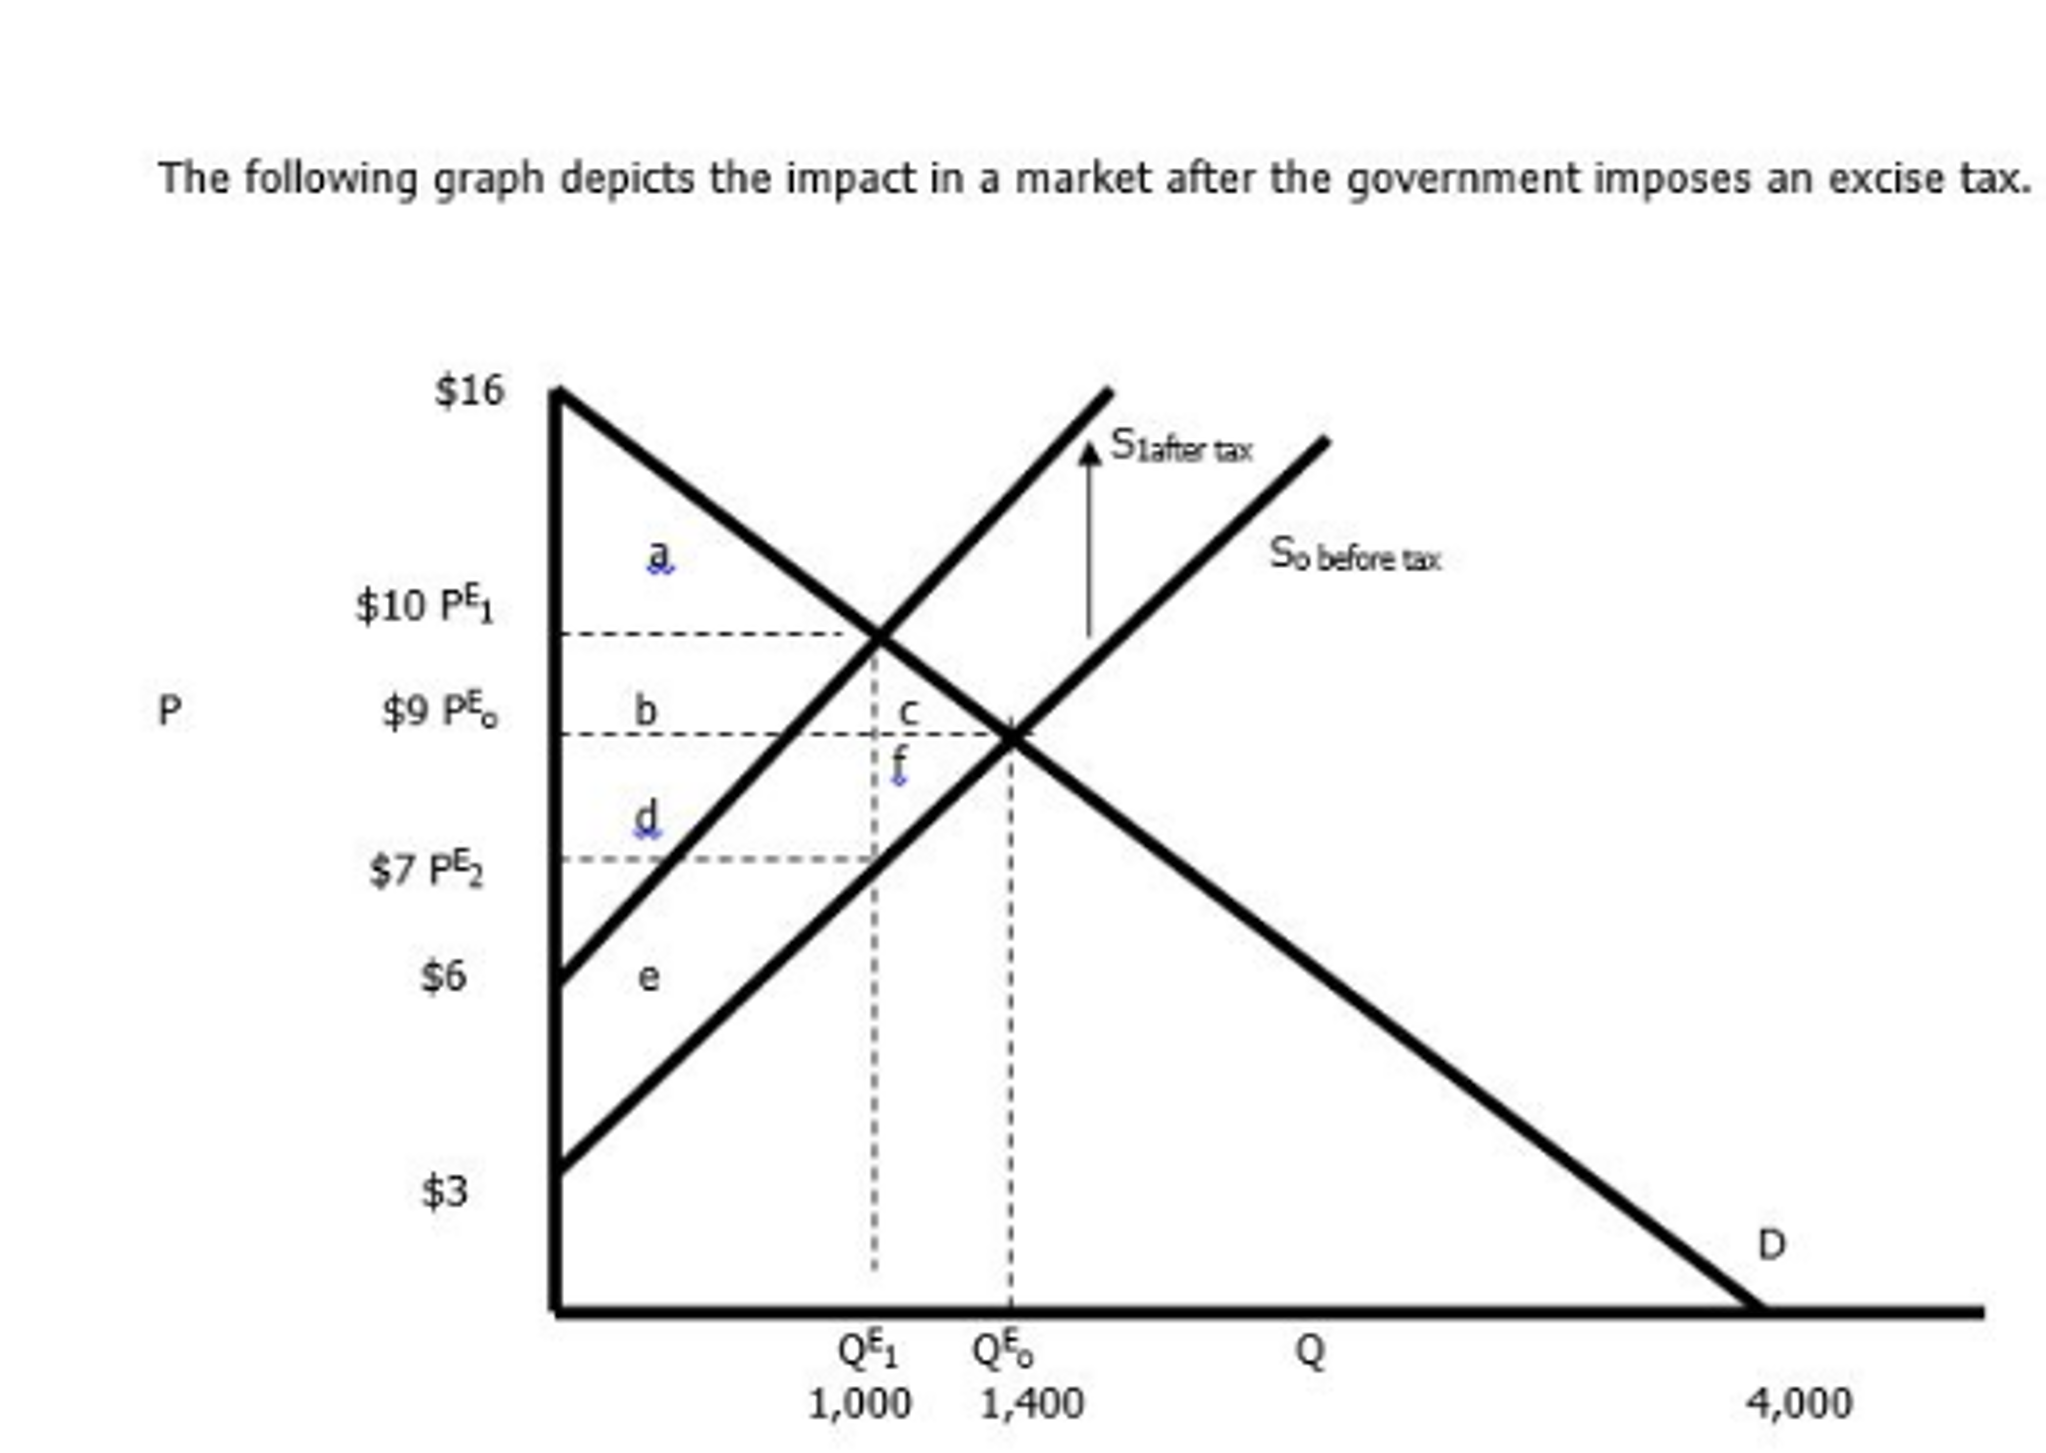
Let's break down each part of the graph.
is pretty easy to spot: it's the triangle under D and above the new price, where S+Tax intersects D. This is triangle A in the graph.
is a bit trickier. Remember that while a price of 3 tax (we know it's 7, not 10. Thus, is triangle E.
between triangles A and E is the tax revenue given to the government. This is the equilibrium quantity times the size of the tax, rectangle B+D.
Finally, we see the lost , triangle C+F. This is our .
Here are all of those pieces highlighted:

Understanding Tax Incidence
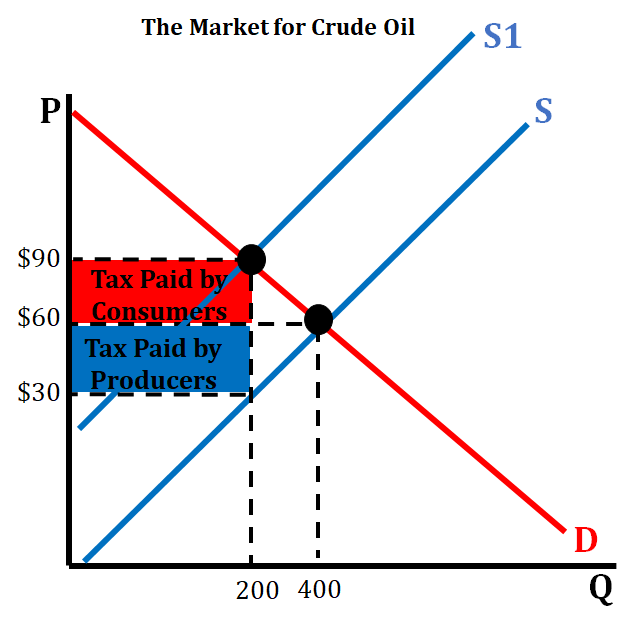
You may notice in the graph that the increase in price was less than the actual tax. This is because both producers and consumers are impacted and share part of the tax. This is called . In the graph, consumers pay a higher price, and by doing so, share in paying the tax. Likewise, the producer is forced to pay since their effective price has decreased (despite the increase in equilibrium price). We can look at how this changes with elasticity in the next section:
Elasticity and Tax Incidence
deals directly with the burden of the excise tax placed on a particular good or service. This helps us determine how much of the tax the consumers pay and how much of the tax the producers pay, based on the elasticity for that good or service.
For example, if demand and supply elasticity is relatively equal, then the consumers and producers will equally pay the same portion of the tax. If you have a situation where demand is relatively elastic and supply is relatively inelastic, then the consumers will pay less of the tax and the producer will pay more of the tax.
When both demand and supply are relatively elastic then the value of the tax will be evenly split between consumers and producers.
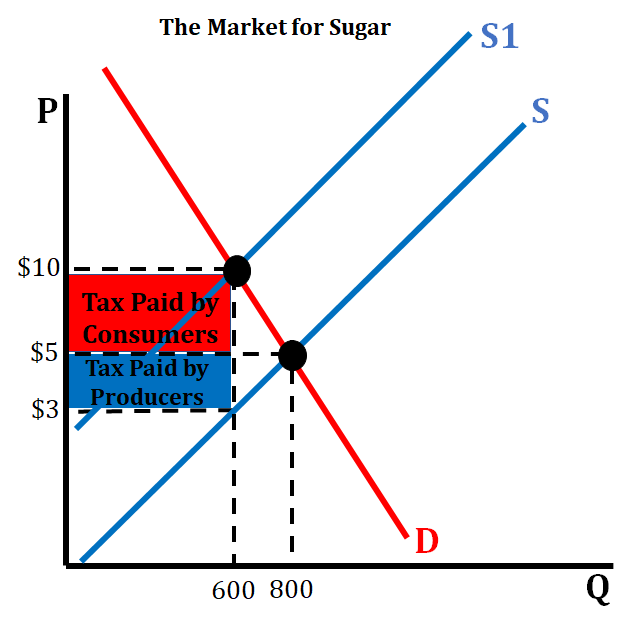
When demand is more inelastic than supply, then consumers will bear more of the burden of the tax than producers.
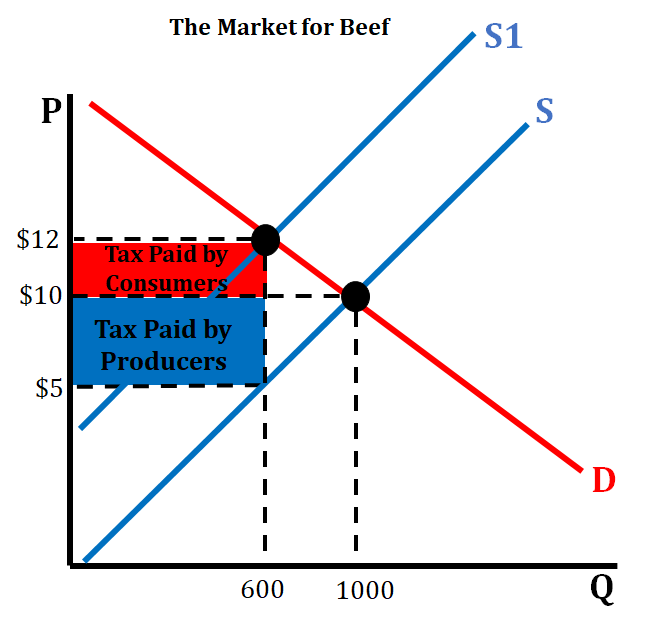
When demand is more elastic than supply, then consumers will bear less of the burden of the tax than producers.
💡You can use the acronym EPIC to remember ! When demand is comparatively Elastic, the burden falls on Producers. when demand is comparatively Inelastic, the burden falls on Consumers.
Key Terms to Review (16)
2.8 The Effects of Government Intervention in Markets
5 min read•june 18, 2024
Jeanne Stansak
dylan_black_2025
Jeanne Stansak
dylan_black_2025
Markets and the Government
In this unit, we define a as a structure that brings together sellers and buyers. However, there is a larger entity that we have yet to consider: the government. In microeconomics, the government has power over markets, and is able to do two main things: controlling prices with ceilings and floors and impacting the price of goods via excise, or per-unit taxes.
This guide will dive into the inner workings of the relationship between the government and markets and visualize how the is impacted by .
Price Controls: Ceilings and Floors
Price Ceilings
As the name implies, a price ceiling is a price maximum. When the government sets a price ceiling, firms are able to sell at any price up to and including the ceiling, but not above it. An example of a price ceiling is rent control, in which the government sets a maximum rent that landlords must abide by. A price ceiling is only effective when the ceiling is below the equilibrium price for the , since otherwise all firms would just sell at the equilibrium price meaning the ceiling has no point.
A ceiling can be seen almost exactly like a like we looked at when discussing disequilibrium. Like before, we have lower quantity supplied from the low price and higher quantity demanded, leading to the following graph:
In this graph, we have a maximum price of Pc. Like before, we have a of all consumers who are willing to pay up to Qs, and a normal . The lost CS and PS is .
Price Floors
A price floor is a price minimum that is set by the government. When a price floor is in place, firms are not allowed to sell their goods or services for a price lower than the floor. An example of a price floor is the , which is the lowest amount that an employer can pay their employees. A price floor is only effective if it is above the equilibrium price for the , as firms will sell their goods or services at the equilibrium price if it is higher than the floor. If the price floor is below the equilibrium price, it will not have any effect on the .
A price floor can lead to a in the , as the quantity of goods or services supplied will be higher than the quantity demanded at the floor price. This can result in a of goods or services, which can lead to lower prices and increased competition among firms. The can also lead to a reduction in the quantity of goods or services produced, as firms may not be able to sell their products at a high enough price to cover their costs. This can lead to a reduction in the overall efficiency of the .
This can be seen in the following graph, with the same logic applied as from a price ceiling:
Non-Effective Price Controls
As we noted before, a price control will only be effective if it excludes the equilibrium price. This is because if it doesn't, firms will just do the same thing they would without the floor: sell at the equilibrium price and quantity. This is an important fact to remember, as sometimes the AP exam will deliberately test your understanding of by giving you a non-effective price control.
Excise Taxes and Tax Incidence
Excise vs. Lump-Sum Taxes
The second action taken by the government is taxation. Taxation is the process by which the government charges a firm a certain amount of money. This can be via. an excise tax or a . An excise tax is also known as a per-unit tax since it is a tax on every single unit produced. By comparison, a is independent of quantity. This section will focus on how impact the supply curve.
Graphing Excise Taxes
An excise tax can be understood as an increase in the costs of production, so an increase in shifts supply to the left:
Let's break down each part of the graph.
is pretty easy to spot: it's the triangle under D and above the new price, where S+Tax intersects D. This is triangle A in the graph.
is a bit trickier. Remember that while a price of 3 tax (we know it's 7, not 10. Thus, is triangle E.
between triangles A and E is the tax revenue given to the government. This is the equilibrium quantity times the size of the tax, rectangle B+D.
Finally, we see the lost , triangle C+F. This is our .
Here are all of those pieces highlighted:
Understanding Tax Incidence
You may notice in the graph that the increase in price was less than the actual tax. This is because both producers and consumers are impacted and share part of the tax. This is called . In the graph, consumers pay a higher price, and by doing so, share in paying the tax. Likewise, the producer is forced to pay since their effective price has decreased (despite the increase in equilibrium price). We can look at how this changes with elasticity in the next section:
Elasticity and Tax Incidence
deals directly with the burden of the excise tax placed on a particular good or service. This helps us determine how much of the tax the consumers pay and how much of the tax the producers pay, based on the elasticity for that good or service.
For example, if demand and supply elasticity is relatively equal, then the consumers and producers will equally pay the same portion of the tax. If you have a situation where demand is relatively elastic and supply is relatively inelastic, then the consumers will pay less of the tax and the producer will pay more of the tax.
When both demand and supply are relatively elastic then the value of the tax will be evenly split between consumers and producers.
When demand is more inelastic than supply, then consumers will bear more of the burden of the tax than producers.
When demand is more elastic than supply, then consumers will bear less of the burden of the tax than producers.
💡You can use the acronym EPIC to remember ! When demand is comparatively Elastic, the burden falls on Producers. when demand is comparatively Inelastic, the burden falls on Consumers.
Key Terms to Review (16)
About Us
Resources
Stay Connected
© 2024 Fiveable Inc. All rights reserved.
AP® and SAT® are trademarks registered by the College Board, which is not affiliated with, and does not endorse this website.
About Us
Resources
© 2024 Fiveable Inc. All rights reserved.
AP® and SAT® are trademarks registered by the College Board, which is not affiliated with, and does not endorse this website.