ELK简介
ELK是一套完整的日志解决方案,由ElasticSearch、Logstash、 Kibana 这三款开源软件组成。
- EastiSearch是基于Lucene开发的分布式存储检引擎,用来存储各类日志;
- Logstash对日志进行收集、分析,并将其存储供以后使用:
- Kibana 是基于Node.js开发的展示工具,为Logstah和ElasticSearch提供用于日志展示的Web界面,还用于帮助汇总、分析和搜索重要日志数据。
ELK官网https://www.elastic.co/products 分别提供包进行下载安装。
ELK工作原理
- 在所有需要收集日志的服务上部署Logstash,作为署Logstash agent用于监控并过滤所收集的日志,将过滤后的内容整合在一起,最终全部交给EastiSearch检索引擎;
- 用EastiSearch进行自定义检索;
- 再通过Kibana通过结合自定义检索内容生成图表,进行日志数据展示。
部署ElasticSearch
1.安装ElasticSearch
rpm --import https://packages.elastic.co/GPG-KEY-elasticsearch

vim elasticsearch.repo        #配置yum源

[elasticsearch-2.x]
name=Elasticsearch repository for 2.x packages
baseurl=http://packages.elastic.co/elasticsearch/2.x/centos
gpgcheck=1
gpgkey=http://packages.elastic.co/GPG-KEY-elasticsearch
enable=1

yum install elasticsearch -y    #yum安装elasticsearch
2.安装Java
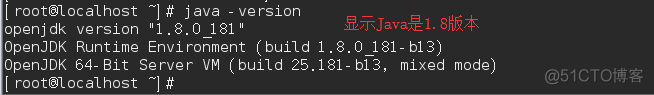
yum install java -y

java -version
3.修改配置文件elasticsearch.yml
cd /etc/elasticsearch/

vim elasticsearch.yml

#17行 集群名称
cluster.name: yun

#23行 节点名称
node.name: node1

#33行 工作目录
path.data: /data/es-data
path.logs: /var/log/elasticsearch/

#43行 防止交换swap分区
bootstrap.memory_lock: true

#54行 监听网络
network.host: 0.0.0.0

#58行 端口
http.port: 9200
4.创建配置文件中的工作目录,并修改其属性
mkdir -p /data/es-data

chown -R elasticsearch:elasticsearch /data/es-data/
5.启动ElasticSearch服务,并查看其端口9200
systemctl start elasticsearch.service

netstat -ntap | grep 9200  #稍微等待一会

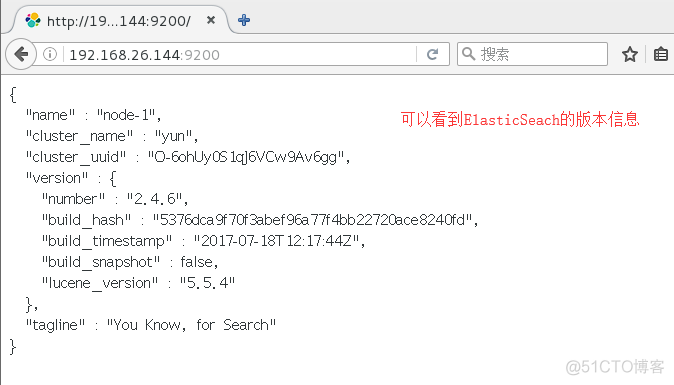
6.通过浏览器访问9200端口
http://192.168.26.144:9200
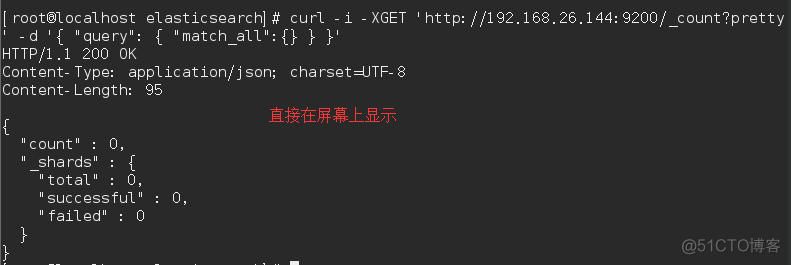
7.ES交互
通过RESTful API (通过json格式交互)
curl -i -XGET 'http://192.168.175.132:9200/_count?pretty' -d '{
"query": {
    "match_all": {}
}
}'
`
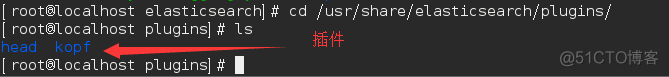
8.安装插件
  #安装ES插件elasticsearch-head
  /usr/share/elasticsearch/bin/plugin install mobz/elasticsearch-head
#安装ES插件elasticsearch-kopf
/usr/share/elasticsearch/bin/plugin install lmenezes/elasticsearch-kopf
安装完成后在plugins目录下可以看到head和kopf
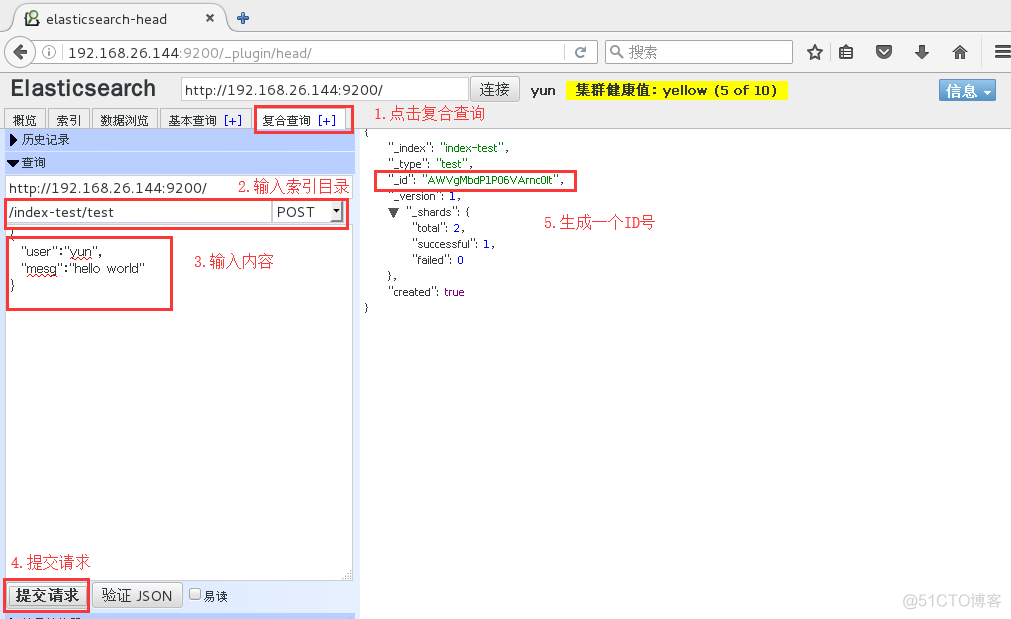
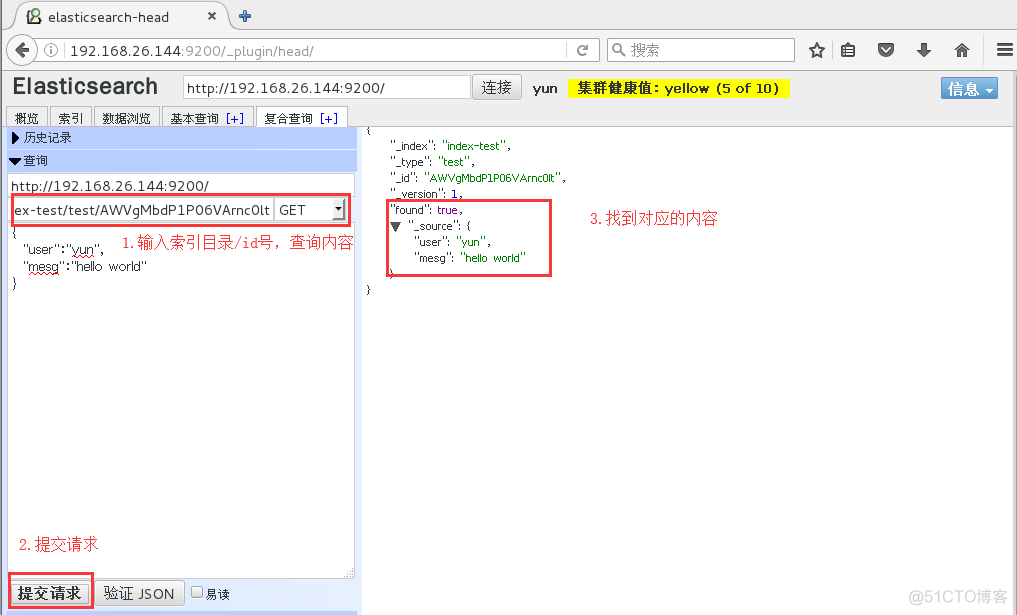
可以在web界面上输入数据,再查询
9.部署ES多集群
在第二台服务器上同时安装ES服务同上,需要注意的是修改配置文件elasticsearch.yml有些许不同。
cd /etc/elasticsearch/
vim elasticsearch.yml
#17行 集群名称
cluster.name: yun
#23行 节点名称
node.name: node2
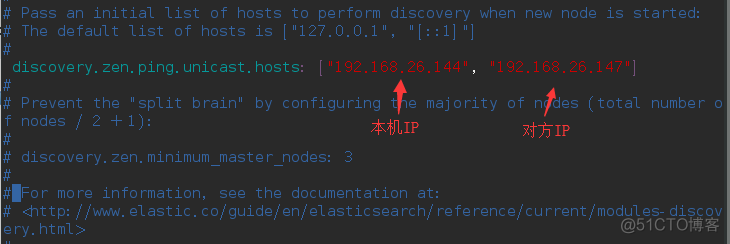
#69行 自动发现机制
discovery.zen.ping.unicast.hosts: ["192.168.26.144", "192.168.26.147"]
 启动elasticsearch
systemctl start elasticsearch.service

netstat -ntap | grep 9200
同样在第一台服务器node1中配置文件修改,再重启服务
#69行 单播列表自动发现机制
discovery.zen.ping.unicast.hosts: ["192.168.26.147", "192.168.26.144"]
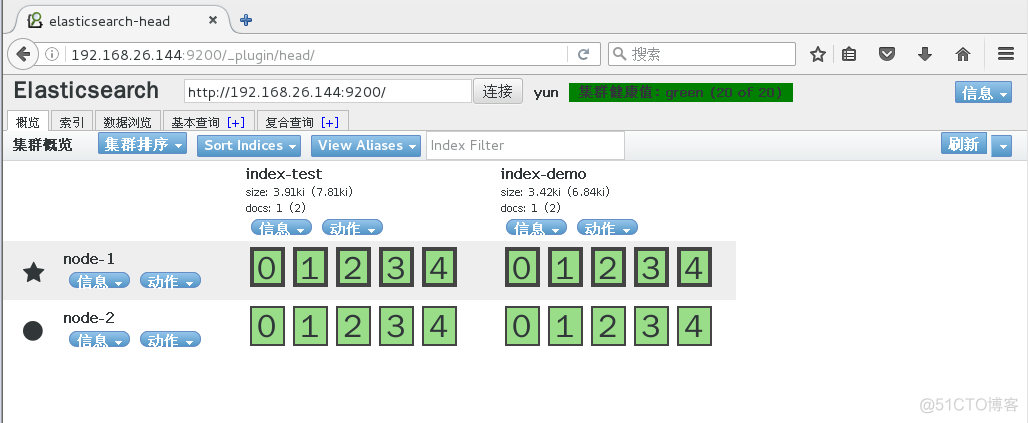
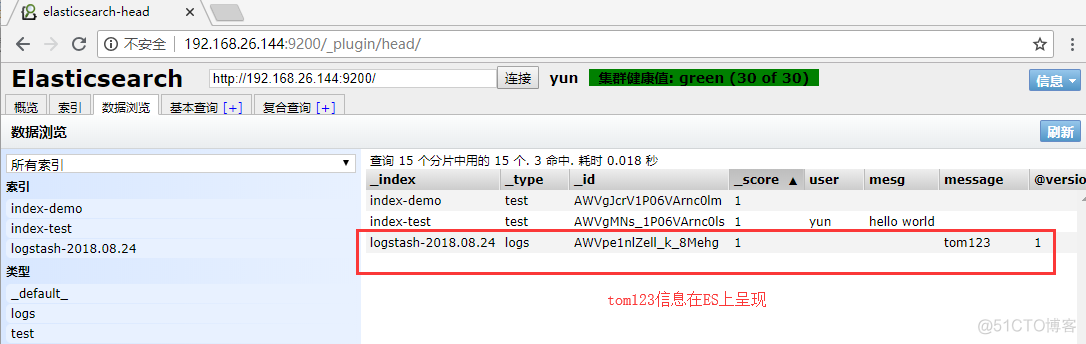
访问head可以看到ES的主分片和副本分片
http://192.168.26.144:9200/_plugin/head/
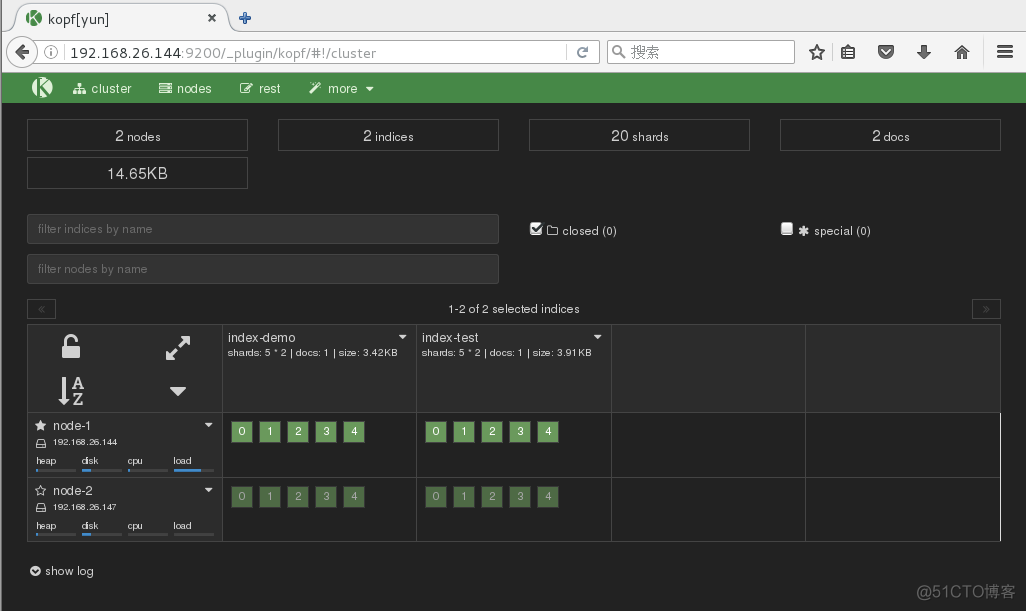
 访问kopf可以看到ES的集群节点信息
http://192.168.26.144:9200/_plugin/kopf/
9.生产环境注意内存解锁和文件限制
less /var/log/elasticsearch/yun.log #查看集群日志提示不让锁内存
 修改配置文件/etc/security/limits.conf
vim /etc/security/limits.conf
#末尾插入
# allow user 'elasticsearch' mlockall
elasticsearch soft memlock unlimited
elasticsearch hard memlock unlimited
* soft nofile 65535
* hard nofile 65535
重启生效
systemctl restart elasticsearch.service
部署Logstash
1.安装Logstash
rpm --import https://packages.elastic.co/GPG-KEY-elasticsearch

vim /etc/yum.repos.d/ogstash.repo  #配置yum源

[logstash-2.1]
name=Logstash repository for 2.1.x packages
baseurl=http://packages.elastic.co/logstash/2.1/centos
gpgcheck=1
gpgkey=http://packages.elastic.co/GPG-KEY-elasticsearch
enable=1

yum install logstash -y
2.创建链接,识别logstash命令
ln -s /opt/logstash/bin/logstash /usr/bin/
3.配置Logstash收集
Logstash使用input和output定义收集日志时的输入和输出。
- input常用的输入源有: file、syslog、redis、log4j、apache log或nginx log,或者其他一些自定义的log格式。
- output常用的输出有: elasticsearch比较常用,fle:写入文件,redis: 写入队列,hdfs: 写入HDFS,需插件支持,zabbix: zabbix监控,mongodb: 写入mongodb库,除此之外编码插件codes也比较常用,经常用来处理json数据或者多行数据源。
(1)定义输入和输出流,类似管道
logstash -e 'input { stdin{} } output { stdout{} }'
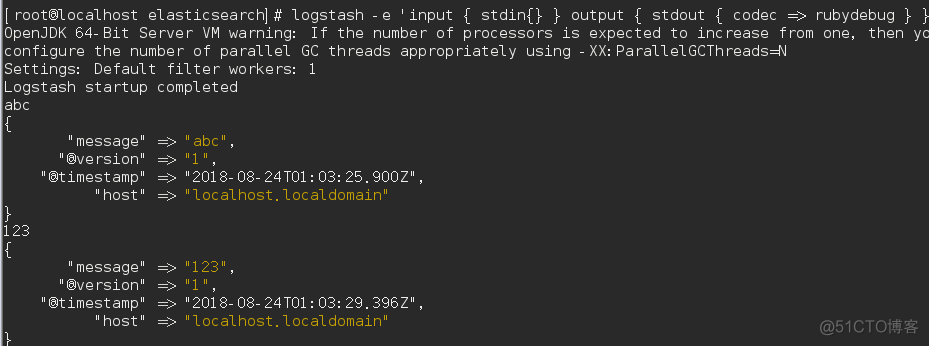
(2)详细格式显示
logstash -e 'input { stdin{} } output { stdout{ codec => rubydebug } }'
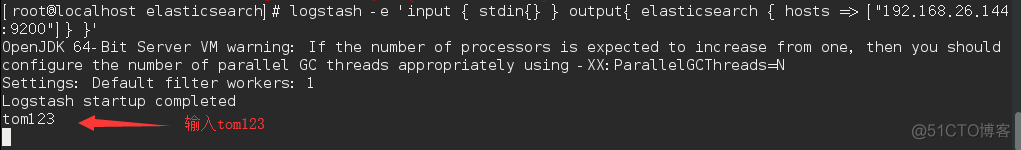
 (3)写入到elasticsearch中
logstash -e 'input { stdin{} } output { elasticsearch { hosts => ["192.168.26.144:9200"] } }'
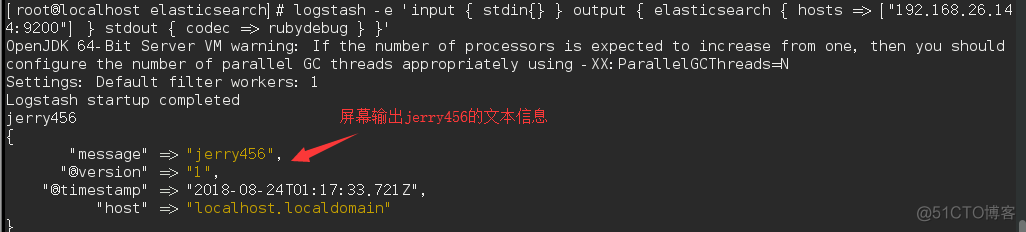
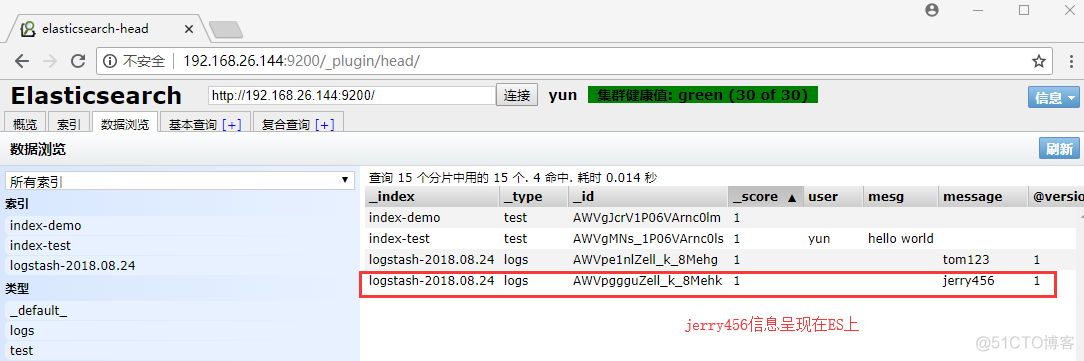
 (4)写入ES和同时生成文本
logstash -e 'input { stdin{} } output { elasticsearch { hosts => ["192.168.26.144:9200"] } stdout { codec => rubydebug } }'
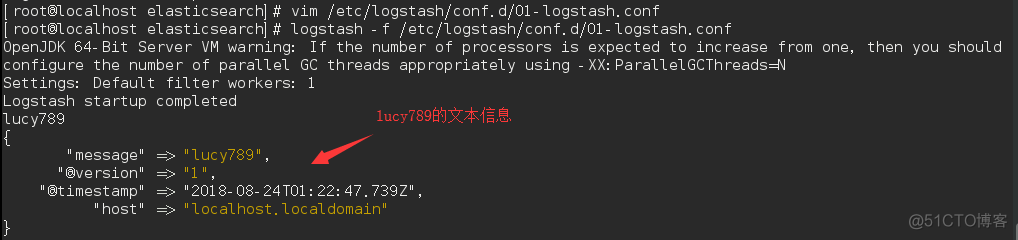
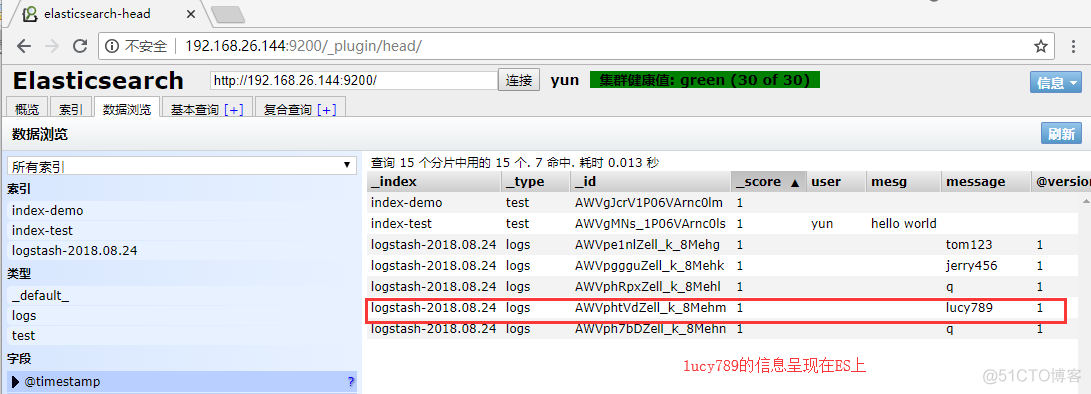
(5)编写配置文件将事件生成到ES
vim /etc/logstash/conf.d/01-logstash.conf

input { stdin { } }
output {
  elasticsearch { hosts => ["localhost:9200"] }
  stdout { codec => rubydebug }
}
logstash -f /etc/logstash/conf.d/01-logstash.conf #配置文件生效
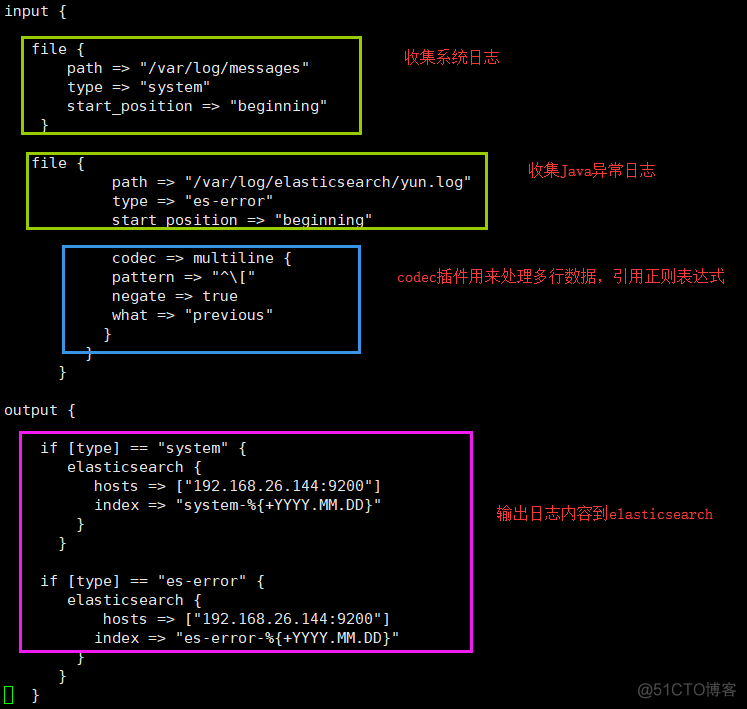
5.使用logstash收集日志(系统日志、java异常日志、事件优化处理)
编写配置文件将日志生成到ES中
vim /root/file.conf
input {
file {
path => "/var/log/messages" #系统日志
type => "system"
start_position => "beginning"
}
file {
path => "/var/log/elasticsearch/yun.log" #java异常日志
type => "es-error"
start_position => "beginning"
codec => multiline { #多行优化处理
pattern => "^\["
negate => true
what => "previous"
}
}
}
output {
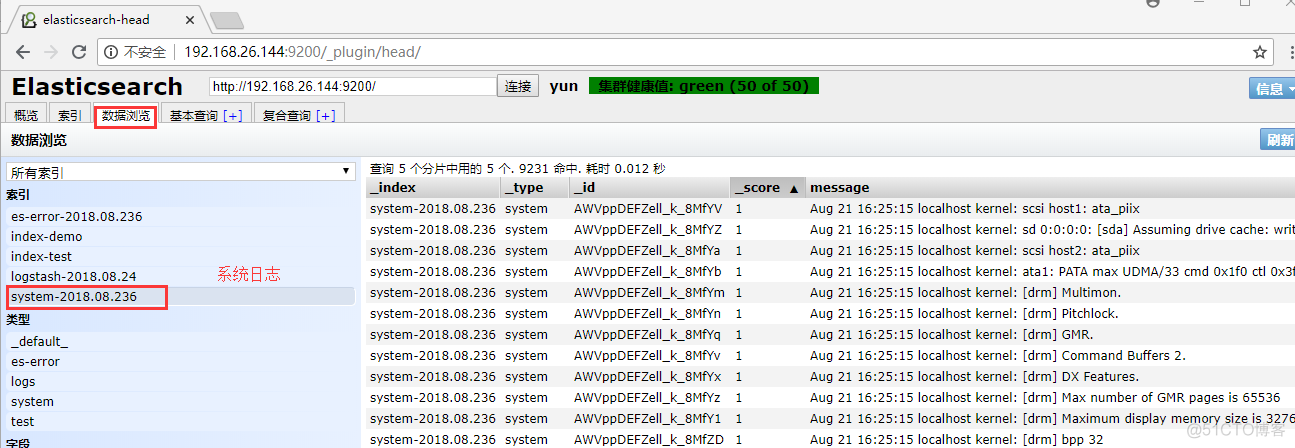
if [type] == "system" {
elasticsearch {
hosts => ["192.168.26.144:9200"]
index => "system-%{+YYYY.MM.dd}"
}
}
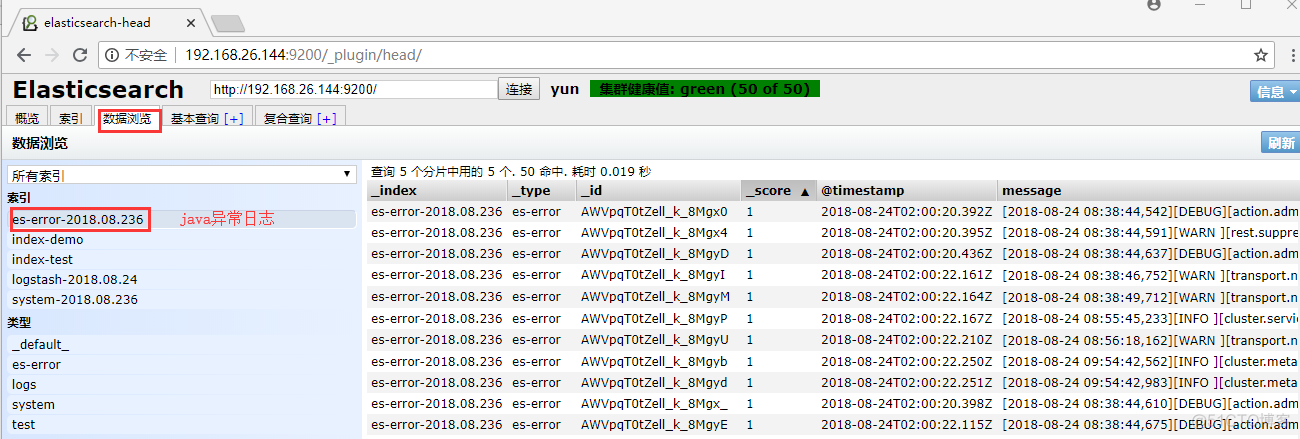
if [type] == "es-error" {
elasticsearch {
hosts => ["192.168.26.144:9200"]
index => "es-error-%{+YYYY.MM.dd}"
}
}
}
logstash -f /root/file.conf #日志生成到ES上
部署kibana
1.安装kibana
wget https://download.elastic.co/kibana/kibana/kibana-4.3.1-linux-x64.tar.gz

tar zxvf kibana-4.3.1-linux-x64.tar.gz -C /opt/

mv /opt/kibana-4.3.1-linux-x64/ /usr/local/

cd /usr/local
mv kibana-4.3.1-linux-x64/ kibana
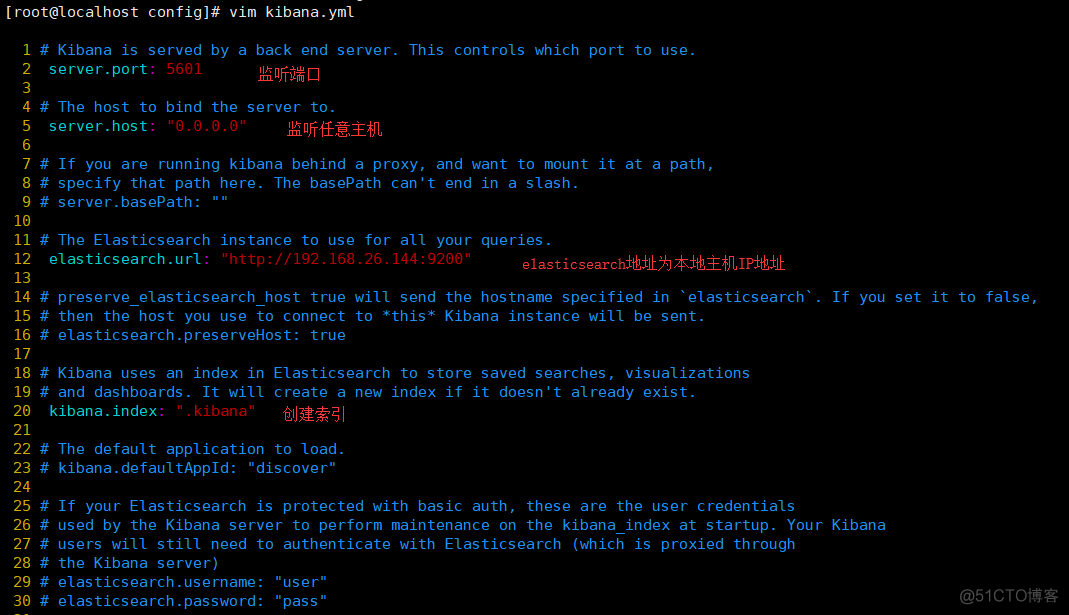
2.编辑kibana配置文件
vim /usr/local/kibana/config/kibana.yml

#2行
server.port: 5601

#5行
server.host: "0.0.0.0"


#12行 ES地址
elasticsearch.url: "http://192.168.26.144:9200"

#20行
kibana.index: ".kibana"
3.启动kibana
yum install screen -y
screen #开启
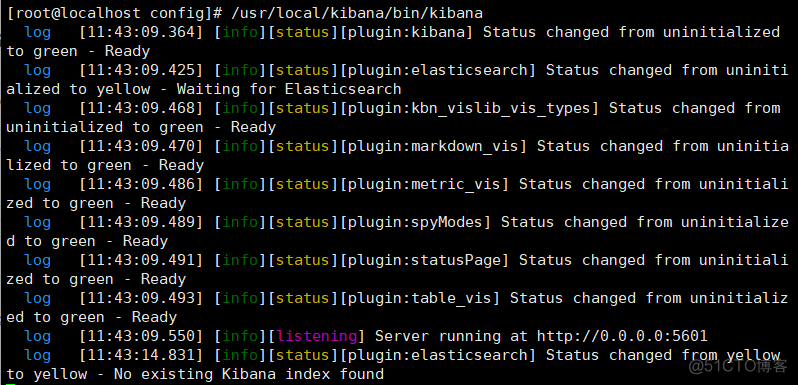
/usr/local/kibana/bin/kibana
 ctrl+a+d 进行丢入后台
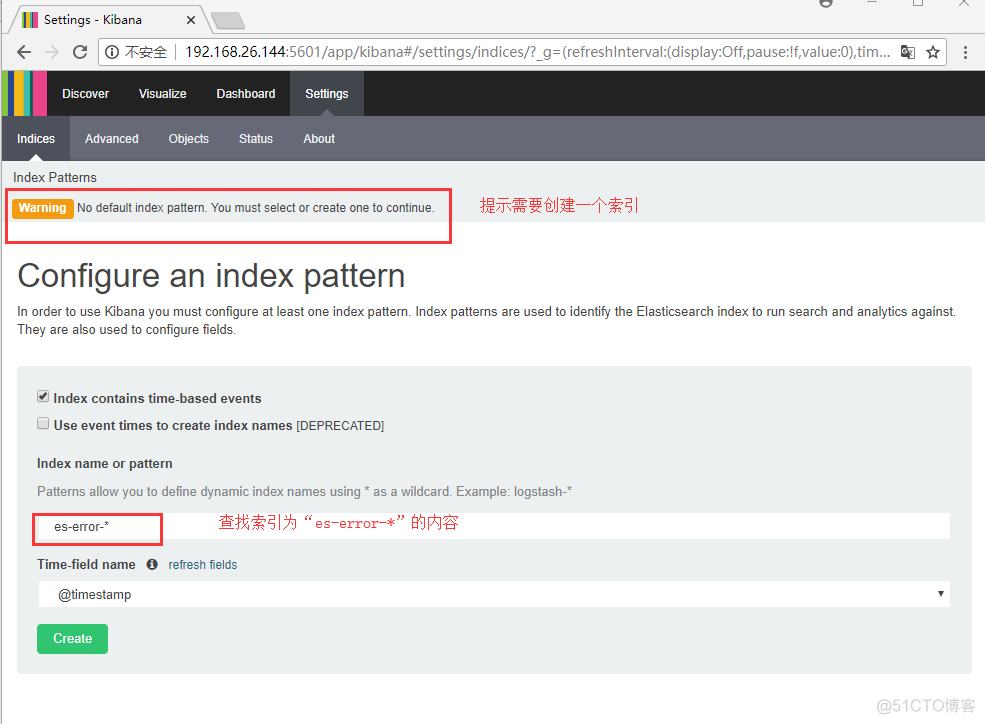
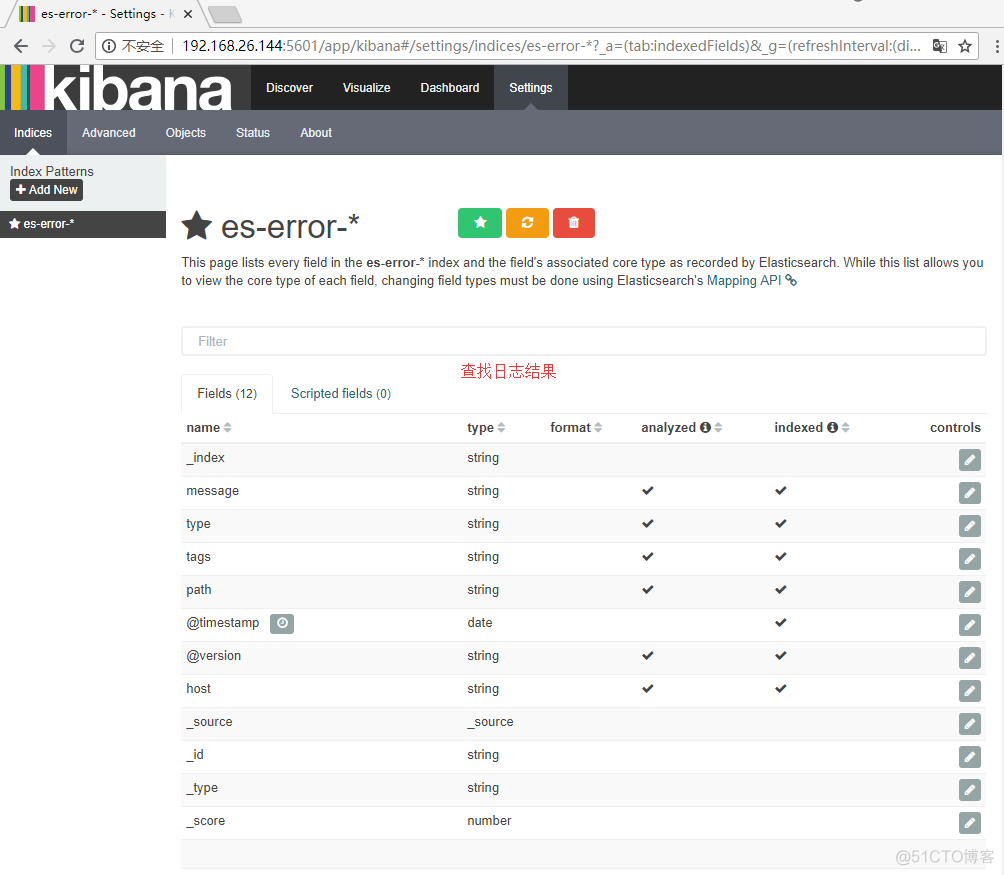
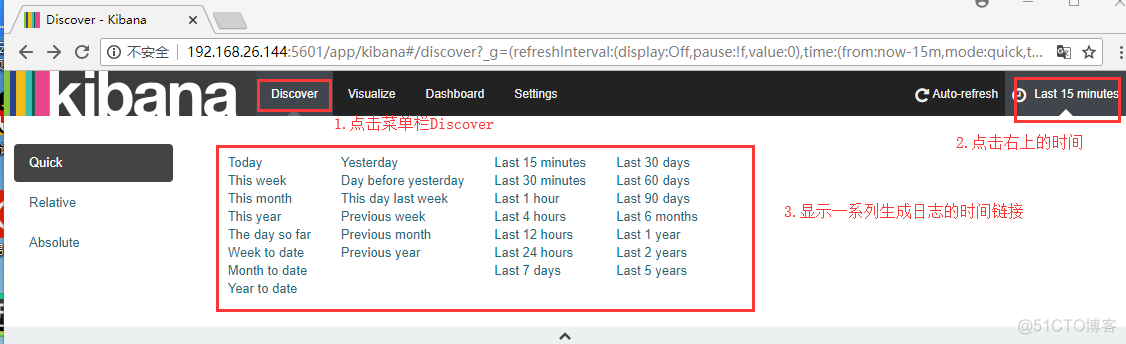
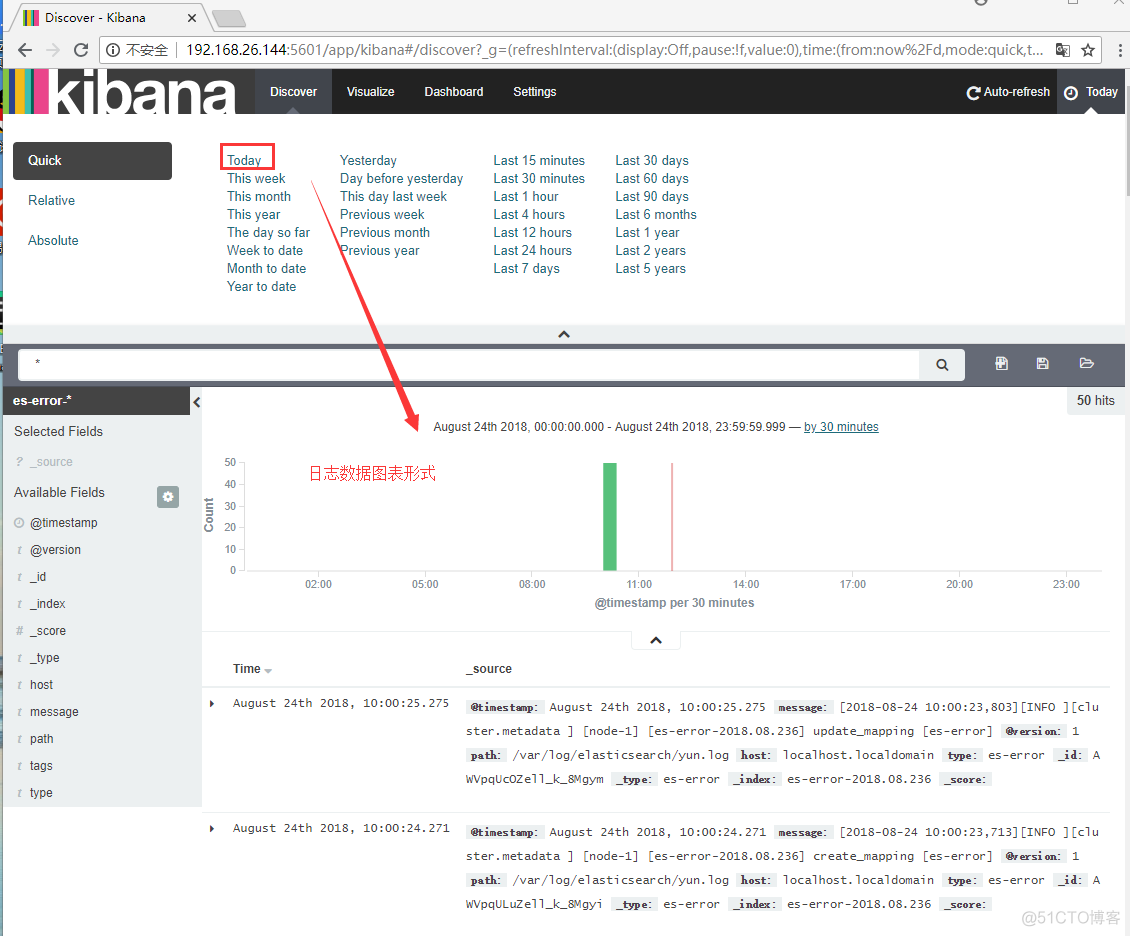
4.访问kibana